Markku Larjavaara,Markku Kanninen,Harold Gordillo,Joni Koskinen,Markus Kukkonen,Niina Käyhkö,Anne M. Larson &Sven Wunder. Global variation in the cost of increasing ecosystem carbon. Nature Climate Change (2017) doi:10.1038/s41558-017-0015-7
Abstract
Slowing the reduction, or increasing the accumulation, of organic carbon stored in biomass and soils has been suggested as a potentially rapid and cost-effective method to reduce the rate of atmospheric carbon increase1. The costs of mitigating climate change by increasing ecosystem carbon relative to the baseline or business-as-usual scenario has been quantified in numerous studies, but results have been contradictory, as both methodological issues and substance differences cause variability2. Here we show, based on 77 standardized face-to-face interviews of local experts with the best possible knowledge of local land-use economics and sociopolitical context in ten landscapes around the globe, that the estimated cost of increasing ecosystem carbon varied vastly and was perceived to be 16–27 times cheaper in two Indonesian landscapes dominated by peatlands compared with the average of the eight other landscapes. Hence, if reducing emissions from deforestation and forest degradation (REDD+) and other land-use mitigation efforts are to be distributed evenly across forested countries, for example, for the sake of international equity, their overall effectiveness would be dramatically lower than for a cost-minimizing distribution.
——————————————————————————–
Daniel W. Urban, Justin Sheffield & David B. Lobell. Historical effects of CO2 and climate trends on global crop water demand. Nature Climate Change 7, 901–905 (2017) doi:10.1038/s41558-017-0011-y
Abstract
A critical question for agricultural production and food security is how water demand for staple crops will respond to climate and carbon dioxide (CO2) changes1, especially in light of the expected increases in extreme heat exposure2. To quantify the trade-offs between the effects of climate and CO2 on water demand, we use a ‘sink-strength’ model of demand3,4 which relies on the vapour-pressure deficit (VPD), incident radiation and the efficiencies of canopy-radiation use and canopy transpiration; the latter two are both dependent on CO2. This model is applied to a global data set of gridded monthly weather data over the cropping regions of maize, soybean, wheat and rice during the years 1948–2013. We find that this approach agrees well with Penman–Monteith potential evapotranspiration (PM) for the C3 crops of soybean, wheat and rice, where the competing CO2 effects largely cancel each other out, but that water demand in maize is significantly overstated by a demand measure that does not include CO2, such as the PM. We find the largest changes in wheat, for which water demand has increased since 1981 over 86% of the global cropping area and by 2.3–3.6 percentage points per decade in different regions.
——————————————————————————–
Charles D. Koven, Gustaf Hugelius, David M. Lawrence & William R. Wieder. Higher climatological temperature sensitivity of soil carbon in cold than warm climates. Nature Climate Change 7, 817–822 (2017) doi:10.1038/nclimate3421
Abstract
The projected loss of soil carbon to the atmosphere resulting from climate change is a potentially large but highly uncertain feedback to warming. The magnitude of this feedback is poorly constrained by observations and theory, and is disparately represented in Earth system models (ESMs)1,2,3. To assess the climatological temperature sensitivity of soil carbon, we calculate apparent soil carbon turnover times4 that reflect long-term and broad-scale rates of decomposition. Here, we show that the climatological temperature control on carbon turnover in the top metre of global soils is more sensitive in cold climates than in warm climates and argue that it is critical to capture this emergent ecosystem property in global-scale models. We present a simplified model that explains the observed high cold-climate sensitivity using only the physical scaling of soil freeze–thaw state across climate gradients. Current ESMs fail to capture this pattern, except in an ESM that explicitly resolves vertical gradients in soil climate and carbon turnover. An observed weak tropical temperature sensitivity emerges in a different model that explicitly resolves mineralogical control on decomposition. These results support projections of strong carbon–climate feedbacks from northern soils5,6 and demonstrate a method for ESMs to capture this emergent behaviour.
——————————————————————————–
Ethan E. Butler, et al. Mapping local and global variability in plant trait distributions. PNAS, doi: 10.1073/pnas.1708984114
Abstract
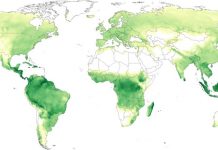
Our ability to understand and predict the response of ecosystems to a changing environment depends on quantifying vegetation functional diversity. However, representing this diversity at the global scale is challenging. Typically, in Earth system models, characterization of plant diversity has been limited to grouping related species into plant functional types (PFTs), with all trait variation in a PFT collapsed into a single mean value that is applied globally. Using the largest global plant trait database and state of the art Bayesian modeling, we created fine-grained global maps of plant trait distributions that can be applied to Earth system models. Focusing on a set of plant traits closely coupled to photosynthesis and foliar respiration—specific leaf area (SLA) and dry mass-based concentrations of leaf nitrogen and phosphorus, we characterize how traits vary within and among over 50,000 ~ 50*50 -km cells across the entire vegetated land surface. We do this in several ways—without defining the PFT of each grid cell and using 4 or 14 PFTs; each model’s predictions are evaluated against out-of-sample data. This endeavor advances prior trait mapping by generating global maps that preserve variability across scales by using modern Bayesian spatial statistical modeling in combination with a database over three times larger than that in previous analyses. Our maps reveal that the most diverse grid cells possess trait variability close to the range of global PFT means.
——————————————————————————–
Robin R. White and Mary Beth Hall. Nutritional and greenhouse gas impacts of removing animals from US agriculture. PNAS, 2017, 114(48): E10301–E10308, doi: 10.1073/pnas.1707322114
Abstract
As a major contributor to agricultural greenhouse gas (GHG) emissions, it has been suggested that reducing animal agriculture or consumption of animal-derived foods may reduce GHGs and enhance food security. Because the total removal of animals provides the extreme boundary to potential mitigation options and requires the fewest assumptions to model, the yearly nutritional and GHG impacts of eliminating animals from US agriculture were quantified. Animal-derived foods currently provide energy (24% of total), protein (48%), essential fatty acids (23–100%), and essential amino acids (34–67%) available for human consumption in the United States. The US livestock industry employs 1.6 × 10⁶ people and accounts for $31.8 billion in exports. Livestock recycle more than 43.2 × 10⁹ kg of human-inedible food and fiber processing byproducts, converting them into human-edible food, pet food, industrial products, and 4 × 10⁹ kg of N fertilizer. Although modeled plants-only agriculture produced 23% more food, it met fewer of the US population’s requirements for essential nutrients. When nutritional adequacy was evaluated by using least-cost diets produced from foods available, more nutrient deficiencies, a greater excess of energy, and a need to consume a greater amount of food solids were encountered in plants-only diets. In the simulated system with no animals, estimated agricultural GHG decreased (28%), but did not fully counterbalance the animal contribution of GHG (49% in this model). This assessment suggests that removing animals from US agriculture would reduce agricultural GHG emissions, but would also create a food supply incapable of supporting the US population’s nutritional requirements.


